40.8952
-111.88
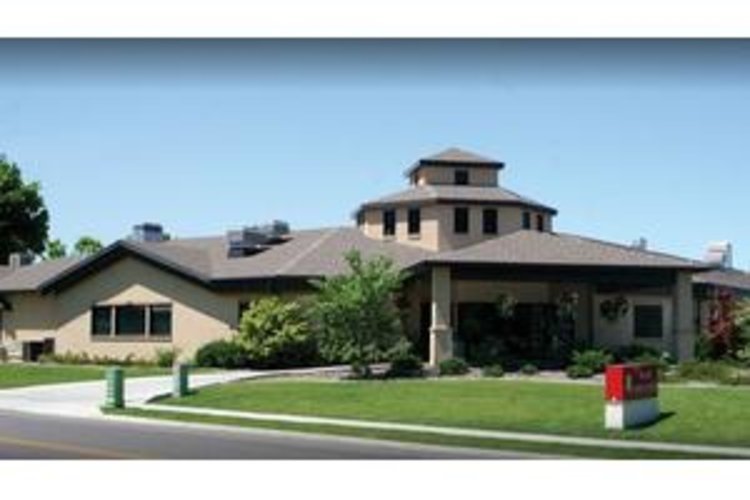
Avalon Care Center – Bountiful
$ Call for Rates
523 N Main Street, Bountiful, UT 84010
$ Call for Rates
523 N Main Street, Bountiful, UT 84010
Care Types: Nursing Care, Memory Care, Assisted Living
Avalon Care Center ��� Bountiful is located in the quiet suburban city of Bountiful, Utah, close to the municipality���s main thoroughfare. Residents of Bountiful can take advantage of the location���s easy access to both major regional health facilities and extensive nearby recreational areas.
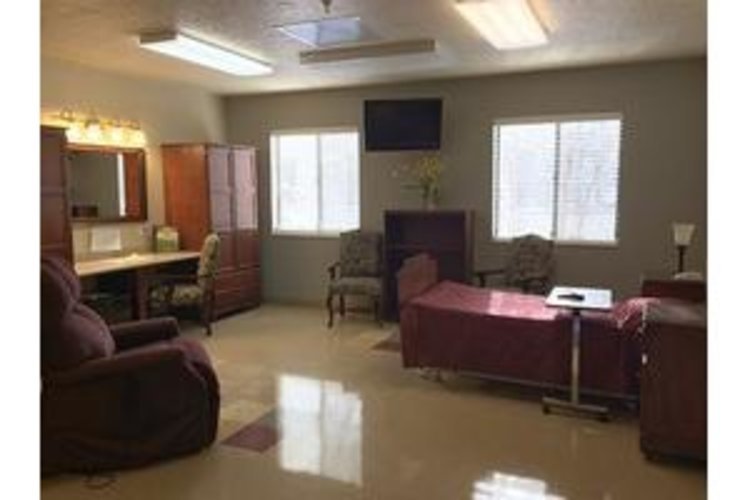
Resident services at Avalon Care Center ��� Bountiful include short-term rehabilitation with private suites as an option, memory care, long-term living, respite care and wound management. Physical therapy and medication management are also available. Residents can request assistance from the professionally trained staff with their daily grooming and hygiene needs. …. SHOW MORE
Avalon Care Center also provides indoor and outdoor amenities. Outdoor patio and landscaped garden spaces neatly surround the residence, and individual rooms are comfortably appointed with modern digital and security technologies. Residents and visitors can also enjoy daily home-cooked meals as well as a menu of recreational activity options.
SHOW LESS
30%
Single
Marital Status
60%
Married Couples
Community
76%
Drove By Themselves
Commute
3%
Below 9th Grade
Highest Level of Education
35%
Children
Adult vs. Children
17%
0-9
Population by Age
17%
0-9
Males by Age Distribution
16%
0-9
Females by Age Distribution
| Status | Percentage |
|---|---|
| 0-9 | 17% |
| 10-19 | 16% |
| 20-29 | 15% |
| 30-39 | 14% |
| 40-49 | 11% |
| 50-59 | 9% |
| 60-69 | 8% |
| 70-79 | 8% |
| 80 Above | 2% |
| Status | Percentage |
|---|---|
| 0-9 | 16% |
| 10-19 | 16% |
| 20-29 | 15% |
| 30-39 | 14% |
| 40-49 | 11% |
| 50-59 | 10% |
| 60-69 | 8% |
| 70-79 | 8% |
| 80 Above | 3% |
| Status | Percentage |
|---|---|
| Single | 30% |
| Married (Not Separated) | 55% |
| Separated | 2% |
| Widowed | 4% |
| Divorced | 9% |
| Status | Percentage |
|---|---|
| Married Couples | 60% |
| Single Females | 9% |
| Single Males | 4% |
| Living Alone | 7% |
| Living With Family | 20% |
| Status | Percentage |
|---|---|
| Drove By Themselves | 76% |
| Public Transportation | 2% |
| Carpooled | 12% |
| Walked | 3% |
| Occasional Drive | 0% |
| Work At Home | 5% |
| Other | 2% |
| Status | Percentage |
|---|---|
| Below 9th Grade | 3% |
| Bachelors Degree | 20% |
| High School | 23% |
| College | 28% |
| Associate Degree | 10% |
| 9th to 12th Grade | 6% |
| Graduate | 10% |
| Status | Percentage |
|---|---|
| Children | 35% |
| Adult | 65% |
| Status | Percentage |
|---|---|
| 0-9 | 17% |
| 10-19 | 17% |
| 20-29 | 15% |
| 30-39 | 15% |
| 40-49 | 11% |
| 50-59 | 10% |
| 60-69 | 8% |
| 70-79 | 4% |
| 80 Above | 2% |
| Status | Percentage |
|---|---|
| 0-9 | 17% |
| 10-19 | 16% |
| 20-29 | 15% |
| 30-39 | 14% |
| 40-49 | 11% |
| 50-59 | 9% |
| 60-69 | 8% |
| 70-79 | 8% |
| 80 Above | 2% |
| Status | Percentage |
|---|---|
| 0-9 | 16% |
| 10-19 | 16% |
| 20-29 | 15% |
| 30-39 | 14% |
| 40-49 | 11% |
| 50-59 | 10% |
| 60-69 | 8% |
| 70-79 | 8% |
| 80 Above | 3% |
By clicking “Request Info” you agree to our Terms of Use and Privacy Policy. You also consent to receive texts and calls, which may be autodialed, from us and our partner providers; however, your consent is not a condition to using our service.

By clicking “Request Info”, you agree to our Terms of Use, our Privacy Policy, and our Agreement to be Contacted by Telephone. You also consent that we, or our partner providers, may reach out to you about senior living solutions or Medicare insurance using a system that can auto-dial; however, you do not need to consent to this to use our service.