40.4548
-80.0267
Driving Directions
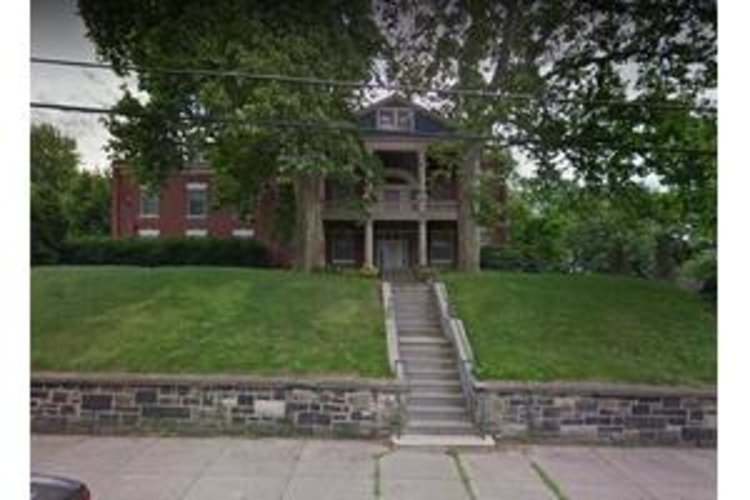
Street View
Photos
Map
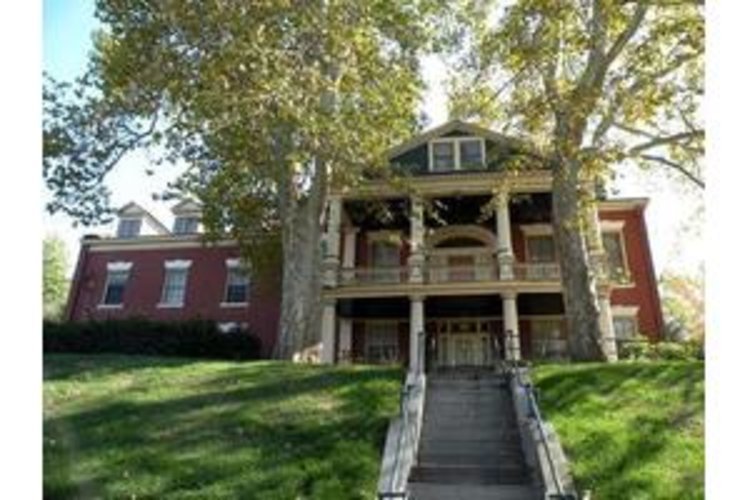
Anderson Manor
$ Call for Rates
1423 Liverpool St, Pittsburgh, PA 15233
Overview
Care Types: Assisted Living, Retirement
To learn more about this provider�s license and review other available state reports, please visit:
Pennsylvania Department of Human Services Provider Directory
….
SHOW MORE
Contact for available floor plans
Contact for available Payment Options
Neighborhood & Demographics
10 closest amenities
Show Map Show List
10 closest amenities
Grocery stores
Coffee shops
Gas Stations
Restaurants
Pharmacies
Financial services
Powered by 
