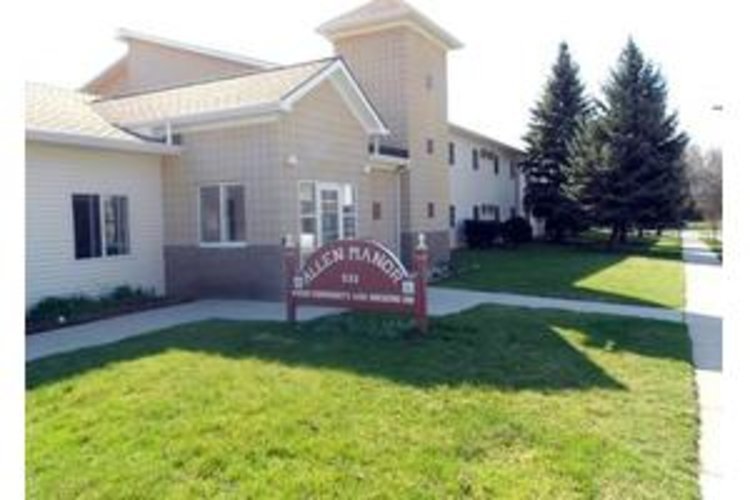

Allen Manor
$ Call for Rates
532 James Ave SE, Grand Rapids, MI 49503
Overview
Care Types: Independent Living, Low Income-Affordable
Welcome to Allen Manor! Living at Allen Manor means more than having an affordable place to live, it’s about being part of a community of neighbors to share your days. Enjoy bingo, monthly birthday party potlucks and gathering in the community room to talk or watch TV. A variety of entertaining and educational programs are always on the calendar for your enjoyment. Plus, we’re located just two blocks from The Rapid bus routes on Wealthy Street and Eastern Avenue so getting around town is easy and convenient.
Contact for available floor plans
Contact for available Payment Options
Neighborhood & Demographics

DEMOGRAPHIC BREAKDOWN
34%
Single
Marital Status
47%
Married Couples
Community
83%
Drove By Themselves
Commute
3%
Below 9th Grade
Highest Level of Education
27%
Children
Adult vs. Children
12%
0-9
Population by Age
12%
0-9
Males by Age Distribution
11%
0-9
Females by Age Distribution
Males by Age Distribution
| Status | Percentage |
|---|---|
| 0-9 | 12% |
| 10-19 | 13% |
| 20-29 | 13% |
| 30-39 | 11% |
| 40-49 | 12% |
| 50-59 | 14% |
| 60-69 | 11% |
| 70-79 | 12% |
| 80 Above | 3% |
Females by Age Distribution
| Status | Percentage |
|---|---|
| 0-9 | 11% |
| 10-19 | 12% |
| 20-29 | 12% |
| 30-39 | 11% |
| 40-49 | 12% |
| 50-59 | 14% |
| 60-69 | 12% |
| 70-79 | 12% |
| 80 Above | 5% |
Marital Status
| Status | Percentage |
|---|---|
| Single | 34% |
| Married (Not Separated) | 48% |
| Separated | 1% |
| Widowed | 6% |
| Divorced | 12% |
Community
| Status | Percentage |
|---|---|
| Married Couples | 47% |
| Single Females | 12% |
| Single Males | 4% |
| Living Alone | 10% |
| Living With Family | 26% |
Commute
| Status | Percentage |
|---|---|
| Drove By Themselves | 83% |
| Public Transportation | 1% |
| Carpooled | 9% |
| Walked | 2% |
| Occasional Drive | 0% |
| Work At Home | 4% |
| Other | 1% |
Highest Level of Education
| Status | Percentage |
|---|---|
| Below 9th Grade | 3% |
| Bachelors Degree | 16% |
| High School | 30% |
| College | 24% |
| Associate Degree | 9% |
| 9th to 12th Grade | 7% |
| Graduate | 10% |
Adult vs. Children
| Status | Percentage |
|---|---|
| Children | 27% |
| Adult | 73% |
Population by Age
| Status | Percentage |
|---|---|
| 0-9 | 12% |
| 10-19 | 14% |
| 20-29 | 13% |
| 30-39 | 12% |
| 40-49 | 13% |
| 50-59 | 15% |
| 60-69 | 12% |
| 70-79 | 6% |
| 80 Above | 4% |
Males by Age Distribution
| Status | Percentage |
|---|---|
| 0-9 | 12% |
| 10-19 | 13% |
| 20-29 | 13% |
| 30-39 | 11% |
| 40-49 | 12% |
| 50-59 | 14% |
| 60-69 | 11% |
| 70-79 | 12% |
| 80 Above | 3% |
Females by Age Distribution
| Status | Percentage |
|---|---|
| 0-9 | 11% |
| 10-19 | 12% |
| 20-29 | 12% |
| 30-39 | 11% |
| 40-49 | 12% |
| 50-59 | 14% |
| 60-69 | 12% |
| 70-79 | 12% |
| 80 Above | 5% |
